
WELCOME TO
L!FE BETA TESTING
You’re one of the first people helping build L!FE – a new way to see how your glucose, insulin, food, activity and sleep fit together in one place.
This page explains how to install the beta, what to try first, and how to share feedback. Please use L!FE in your real day-to-day life and tell us honestly what works, what’s confusing, and what’s missing.
L!FE Beta is free during testing.
What you’ll get
-
Daily view of your L!FE
See your glucose, insulin, food, activity, sleep and other key data on one daily timeline so you can spot patterns faster.
-
Smarter post-meal insights
Review your glucose response 2–3 hours after meals, with carbs, insulin and activity shown together to help you spot patterns and understand what may have influenced the result.
-
Hypo recovery tracking
Log hypos, what you used to treat them, and how quickly you recovered so you can see which treatments work best for you. (in development).
-
Food & barcode logging
Search foods, scan barcodes and save favourites so common meals are quick to log and compare.
-
Activity, sleep, BP & weight overlays
Overlay steps, workouts, sleep and weight with your glucose to see how lifestyle shifts affect your control.
-
Direct line to the team
Give feedback straight to the creators. Your comments in this beta will directly influence what we build next.
WHAT TO EXPLORE IN THE BETA

DAILY DASHBOARD
The Daily Dashboard is your home base. It shows how your day fits together – glucose, bolus, food, water, BP, weight, activity, sleep, mindfulness and medications – on one timeline.
Tell us:
Does the dashboard make it clear what data is coming from where?
Is anything you expect to see missing from the daily view?
Is there anything on the screen that feels cluttered or unnecessary?
Health Data
L!FE is built on your real data. It reads from Apple Health and combines that with what you enter in the app, so the Daily Dashboard, Post-Meal and Hypo reports all reflect your actual day.
An iPhone is required for L!FE. If you also use an Apple Watch, more of your activity, heart rate and workout data is logged automatically, so you need to enter less by hand.
What comes from Apple Health
Glucose from your CGM or meter app (if they write to Health).
Insulin from supported pumps / pens that log to Health.
Activity: steps, workouts, distance.
Sleep, weight and other metrics you already track.
What you enter in L!FE
Food (OFF), water and hypo recovery.
Medications and any notes or events you want to track.
You control what L!FE can see in:
Settings → Privacy & Security → Health → L!FE, where you can turn each data type on or off at any time.
Tell us:
Is it clear which data is coming from Health and which is manual?
Were the Health permissions easy to understand and change?
Did any data you expected to see fail to appear in L!FE?

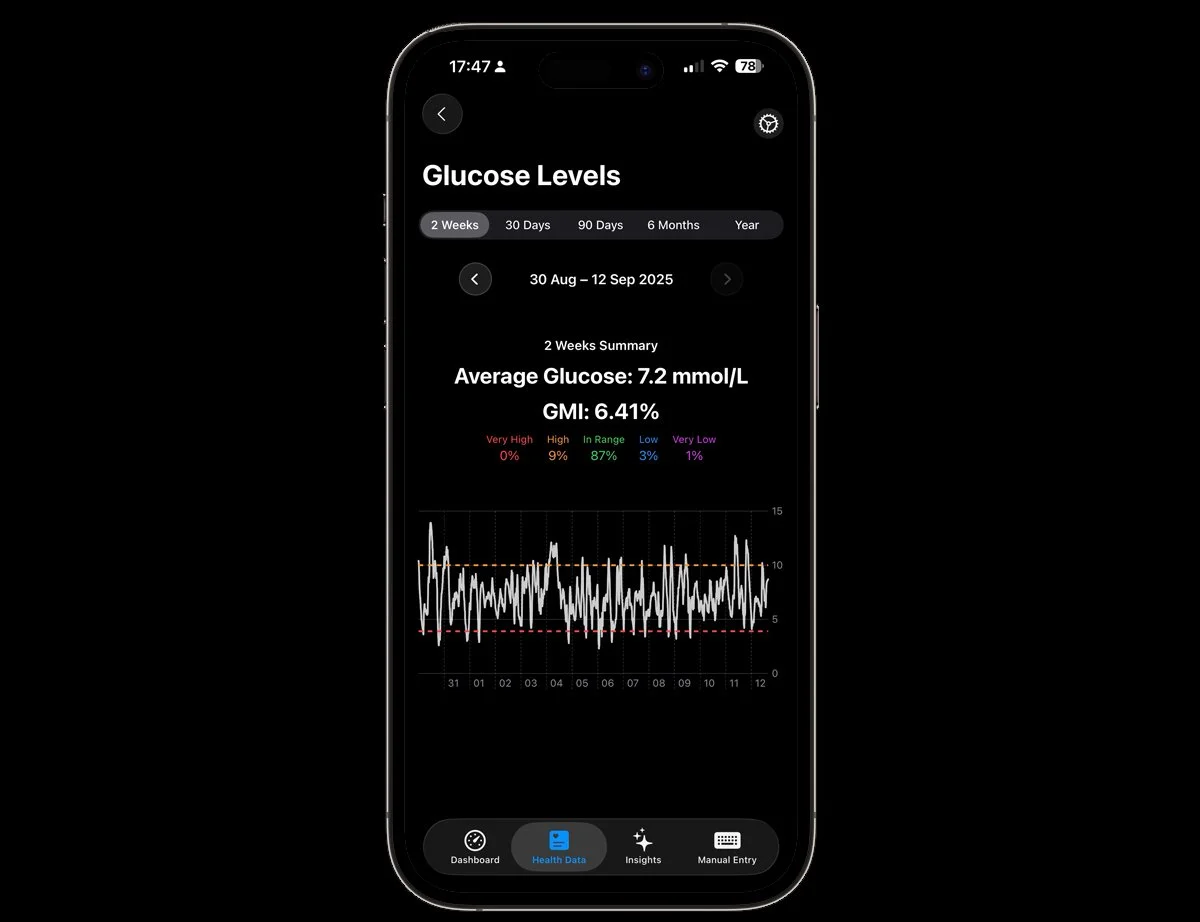
POST-MEAL GLUCOSE REPORT
After you eat, L!FE tracks what happens to your glucose for the next few hours.
Over a few days, log your usual meals (and the bolus you took for them), then review the Post-Meal Glucose report for those meals. Look at:
How high your glucose rises.
How long it takes to come back towards your target range.
How carbs, fat, protein, insulin and activity are shown around the curve.
Tell us:
Is the report easy to find and understand?
Does the graph make sense without extra explanation?
Does it actually help you decide what to change next time (dose timing, amount, food choice, activity)?
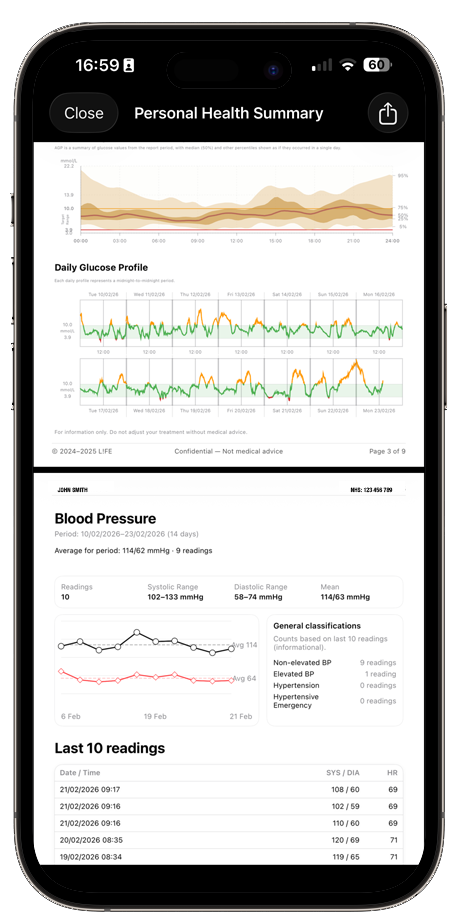
clinician Report
PDF EXPORT
L!FE can generate a PDF report designed to be shared with your diabetes team. It brings together your key metrics and graphs in a format that’s easier to review in clinic than screenshots from your phone.
The report typically includes:
Summary metrics – Time in Range, highs/lows, average glucose and variability over the selected period.
Daily glucose profiles – Glucose curves with insulin, food and key events overlaid.
Post-meal views – How your glucose responds after meals across the week.
Hypos & recovery – When lows happened and how they were treated (where logged).
Activity, sleep and other context – So your team can see what was happening around your numbers.
You can export the PDF and then email it, upload it to a clinic portal or print it for an appointment. The report is generated on your device; you choose how and where to share it.
Tell us:
Is the report easy to find and generate?
Would your clinician understand this without extra explanation from you?
Is there anything important missing, or anything that feels like clutter?
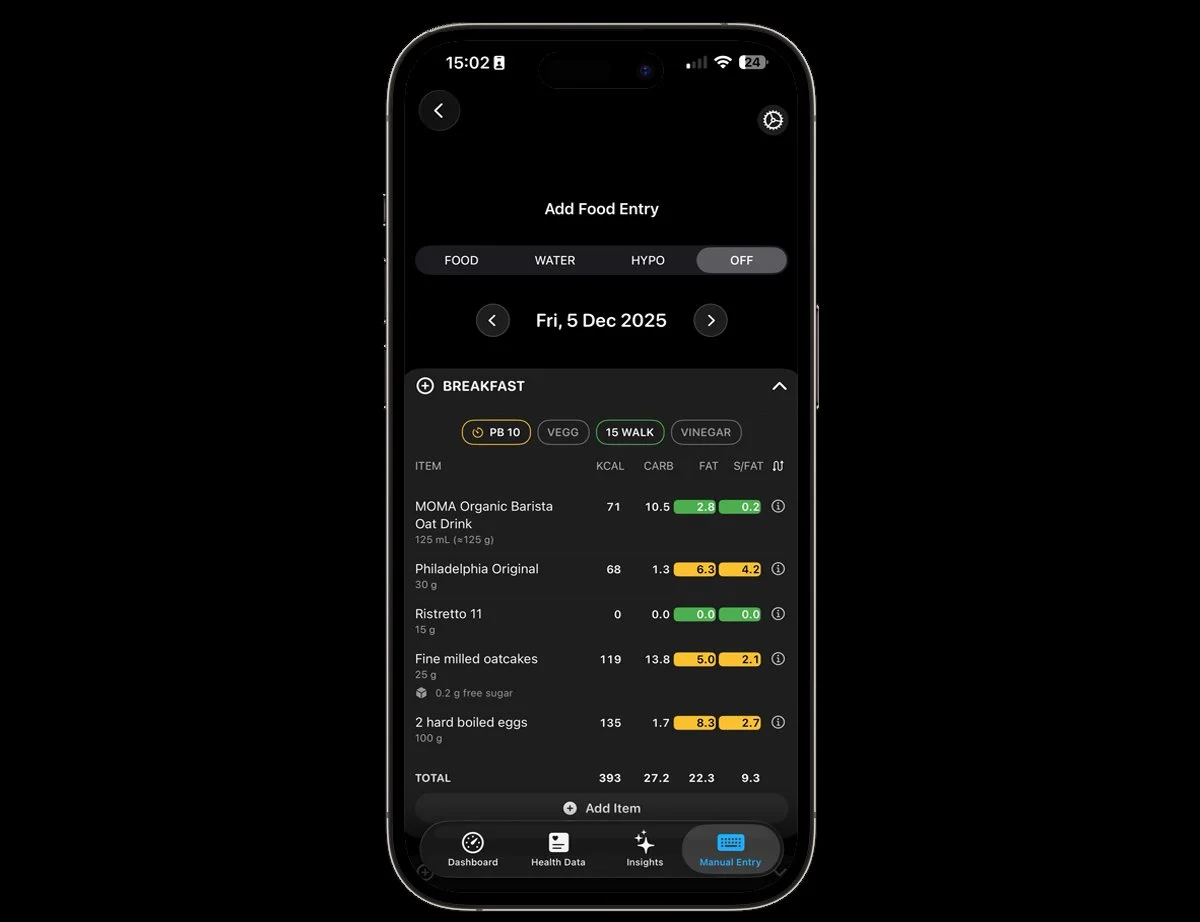
FOOD LOGGING
This part of L!FE is where you record what you eat, drink and how you treat hypos. It has three tabs:
1. Food (OFF - Open Food Facts Integration)
Search foods using our Open Food Facts (OFF) integration.
Scan barcodes to find packaged foods quickly.
Save favourites and common meals so you can log them in a few taps.
See carbs, kcal and other key nutrients for each item you add
If a food is missing or incomplete, you can still log it manually and we’ll improve the database over time.
2. Water
Log your water or other sugar-free drinks through the Water tab.
See how your hydration pattern lines up with your glucose and activity on the daily view.
3. Hypo Recovery
Record each hypo episode and how you treated it (e.g. glucose tabs, juice, sweets), including the amount.
These entries feed into the Hypo Recovery analysis so you can see which treatments work best for you.
Tell us:
Is the Food search and barcode scanning fast enough for everyday use?
Are the three tabs (Food, Water, Hypo) obvious and easy to switch between?
Is anything about logging a hypo or quick carbs confusing or too slow?
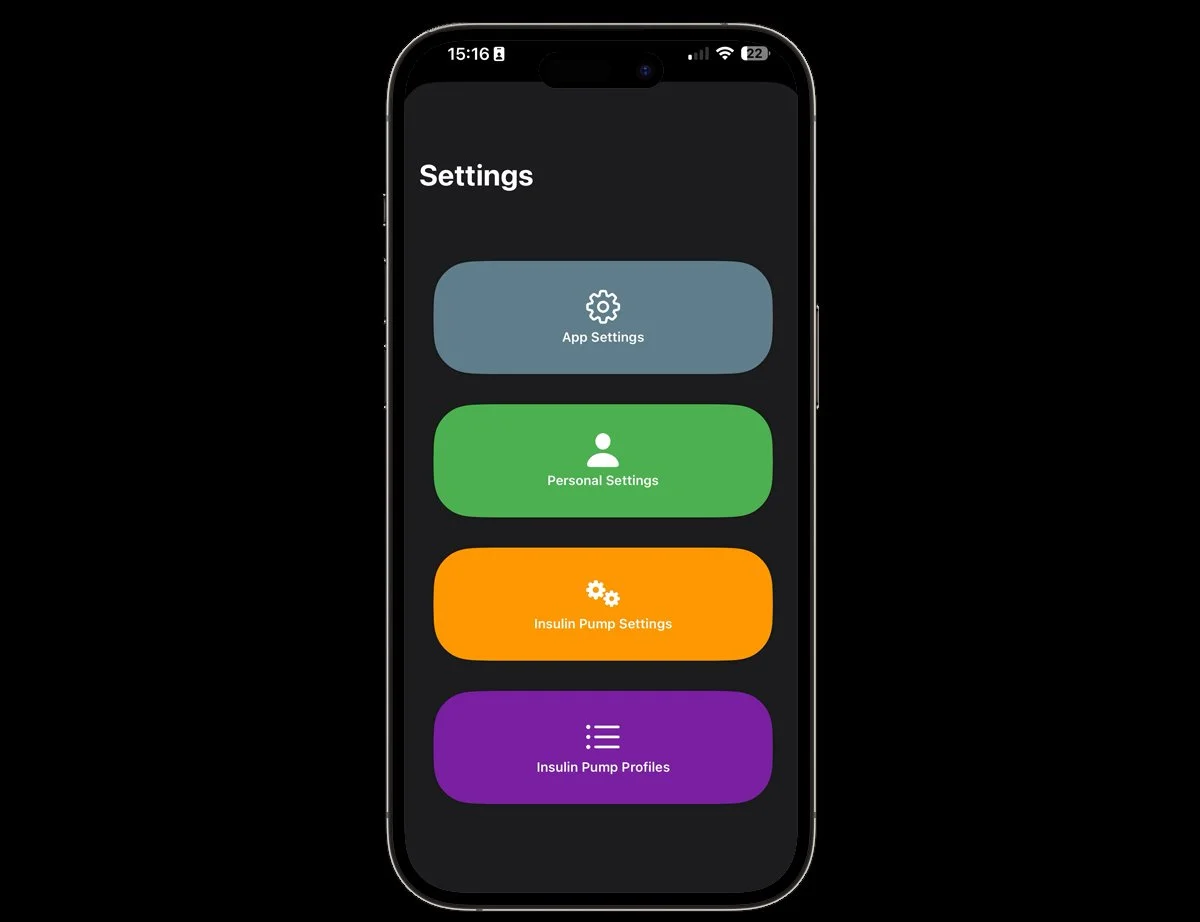
SETTINGS
Settings is where you tell L!FE how you actually run your diabetes so the dashboard and reports make sense for you. There are four main areas:
1. App SettingsControl how L!FE behaves day to day. This is where you review general options such as which features are enabled, how certain views behave, and (where available) things like notifications and report preferences.
2. Personal Settings
Tell L!FE about you and your diabetes. This is where you set up your basic profile and core preferences – the kind of information that helps L!FE interpret your data in the right context.
3. Insulin Pump Settings
Here you define how L!FE should interpret data coming from your pump. It’s about aligning the app with the way your pump is configured, so imported insulin data is displayed correctly in timelines and reports.
4. Insulin Pump Profiles
If you use different pump profiles (for example work days, rest days, exercise-heavy days), this is where you create and manage those profiles inside L!FE. The aim is to make it easier to see how each profile behaves in your data.
Tell us:
Was it obvious where to find each of these four areas?
Did the labels and descriptions make sense without extra explanation?
Is there anything you expected to be able to set up or adjust that isn’t there?

HOW THE L!FE BETA WORKS
L!FE BetA free during testing
Access is via Apple TestFlight on iPhone.
The beta is free for all invited testers.
Features, design and reports will change during testing.
We may reset test data before public release – always keep your primary records in your usual clinical systems.
✺ FAQ ✺
-
L!FE is a data and insight tool. It does not replace medical advice or treatment. Always follow the guidance of your diabetes team.
-
This beta is currently for iPhone and Apple Watch only via TestFlight.
-
L!FE reads data from Apple Health (HealthKit), such as glucose, insulin, carbs, activity, sleep and weight – depending on what you’ve allowed. If your CGM, pump or other apps write to Health, L!FE can read that.
-
In this beta, L!FE only supports insulin pump data import from Tandem.
There is a CSV import option inside the Manual entry area that can read data exported from the Tandem Source website (European portal).
To import:
Log in to Tandem Source and export your data as a CSV file.
Save that CSV file somewhere you can access on your iPhone – ideally a folder in iCloud Drive.
In L!FE, go to the Manual entry / Import feature and select that CSV file.
L!FE will then import the insulin data available in the file and show it in your timelines and reports.
Support for other pumps and import methods may be added in future versions, but is not available in this early beta.
-
Your data stays under your control. We use Apple Health as the primary source of data and store it securely. We do not sell your personal data. For full details, read our L!FE Privacy Policy.
-
We expect this beta phase to run for few months, with regular updates based on feedback. We’ll notify you through TestFlight when a new build is available.
-
You can uninstall L!FE at any time and remove its access in Apple Health. In TestFlight, you can stop testing L!FE with a single tap.
-
Yes – an iPhone is required for L!FE. The main app runs on your iPhone and reads data from Apple Health there.
A L!FE companion app for Apple Watch is also available. It shows your daily dashboard on your wrist, so you can quickly glance at your glucose and key metrics without taking out your phone.
The Apple Watch is optional but very useful: it can automatically track activity, heart rate and workouts into Apple Health, which means more of your day is captured without manual logging.
More Apple Watch features are planned in future updates to make the watch an even more powerful part of your L!FE setup.
-
Aim to use L!FE as you normally would live your life for at least 14 days. Try to log your usual meals, quick carbs for hypos and any key events (exercise, illness, late nights). It doesn’t need to be perfect; we’re more interested in how the app behaves in real life than in “perfectly logged” data.
-
No. L!FE reads data from Apple Health; it does not change settings in your CGM, pump or other apps. You still manage your devices and treatment exactly as before. Think of L!FE as an additional layer that helps you see the full picture in one place.
-
Not in this beta. L!FE does not stream live data to clinics. Instead, you can generate a PDF clinician report from the app and share it yourself (by email, portal upload or printout). You control what you share and when.